Commercial analytics / October 26, 2026
U.S. Potash Summer Fill: A Ten-Year Review
Sometimes you win. Sometimes you lose.
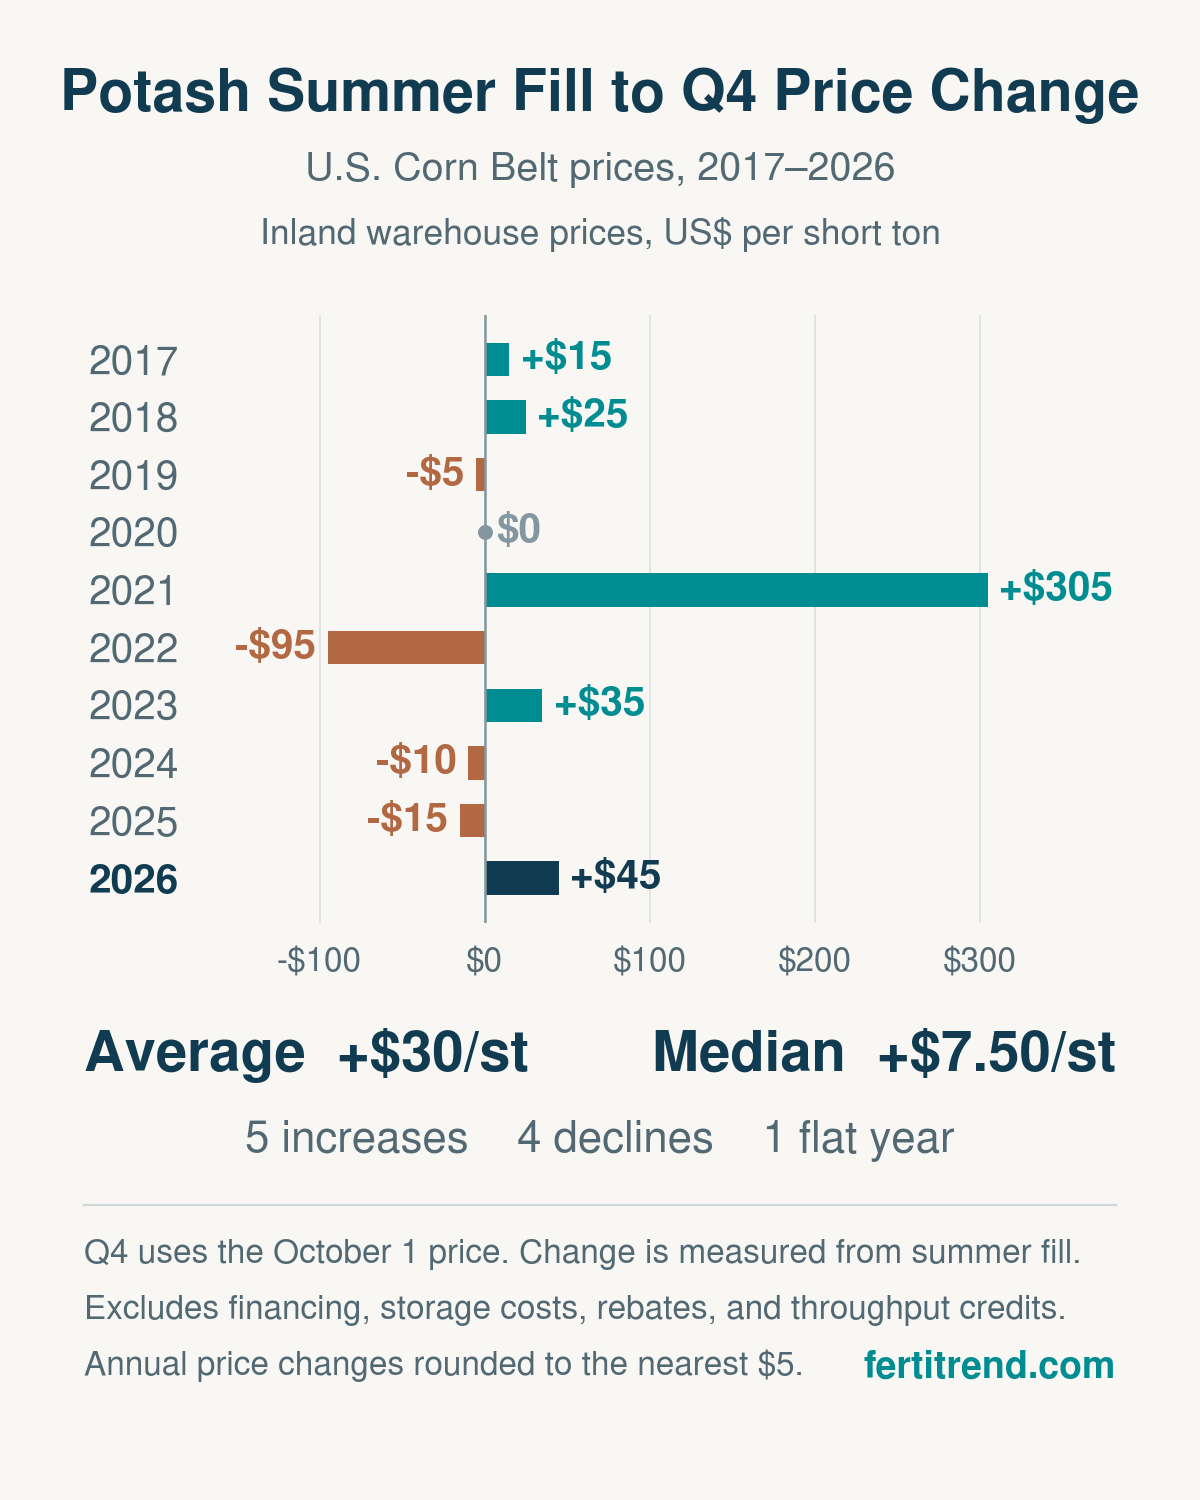
This year's potash summer fill buyers were winners. U.S. Corn Belt inland warehouse potash prices rose $45 per short ton from summer fill to October 1. That was the second-largest increase in the past ten years.
The longer record tells a more balanced story. Prices increased in five years, declined in four, and were flat in one. The average change was +$30/st, but one exceptional year did much of the work.
At a glance
Key Takeaways
- The 2026 price increase was $45/st, second only to 2021 in this ten-year comparison.
- The average price change was +$30/st. The median was +$7.50/st.
- The $305/st increase in 2021 pulled the average substantially higher. The following year brought a $95/st decline.
- Financing, storage costs, rebates, and throughput credits affect how a benchmark price change translates into a commercial result.
Commercial context
Why Summer Fill Matters
Canadian potash producers' summer fill programs help U.S. retailers and wholesalers position potash ahead of fall demand. Product needs to be moved into place before fall applications begin.
For producers, fill programs help move volume into the distribution network ahead of peak demand. For retailers and wholesalers, they provide an opportunity to secure product and arrange deliveries before customers need fertilizer in the field.
That creates a familiar decision. Buying early gives a business time to position inventory, but it also commits working capital and leaves any unpriced tons exposed to a decline in the market.
Ten-year comparison
What the Ten-Year Average Tells Us
The average price change from fill to October 1 was +$30/st over 2017–2026. The median was +$7.50/st, halfway between the two middle observations of $0 and +$15.
The difference is largely explained by 2021. Prices rose $305/st that year, compared with a $95/st decline in 2022, the largest decrease in the sample.
A few calculations show how sensitive the average is:
| Comparison | Average price change |
|---|---|
| All ten years, 2017–2026 | +$30/st |
| Excluding 2021 | Approximately flat |
| Excluding both 2021 and 2022 | About +$11/st |
Both 2021 and 2022 belong in the history. These comparisons show how much exceptional years influence the average. A buyer planning around a routine $30/st seasonal increase would be placing considerable weight on one year's result.
The five increases, four declines, and one flat year describe this historical sample. The next fill decision still depends on the supply, demand, and delivery conditions facing the market at that time.
Exceptional year
Why 2021 Was Different
The 2021 comparison began with an early May fill program. Within a month, Canadian production faced a disruption.
On June 4, Mosaic announced the immediate closure of its K1 and K2 shafts at Esterhazy, Saskatchewan. Accelerating brine inflows brought the closures forward by nine months. [1]
Belarusian supply then became a growing concern. On June 24, the European Union introduced potash trade restrictions following the forced landing of a Ryanair flight and the detention of a dissident journalist and his partner. The United States sanctioned Belaruskali on August 9. [2][3]
The U.S. measures included a wind-down period through December 8, so the October 1 comparison should be understood in the context of sanctions and future supply uncertainty. [4]
By October 1, Corn Belt inland warehouse prices were $305/st above fill. That move still has a large influence on the ten-year average.
Current year
What Drove the 2026 Increase
This year's price increase was not driven by any single major narrative or event.
Reduced offshore imports tightened supply. Slow deliveries made it harder to replenish inventories. Rising grain prices supported demand, although grain prices are now off their pre-harvest peak.
Together, those conditions favored buyers who had already secured product. The $45/st increase was larger than every other increase in the comparison except 2021.
The contrast is useful. Supply can tighten through lower imports and slow replenishment even without a major mine closure or a new sanctions announcement.
Commercial decision
What This Means for a Fill Decision
The chart measures the change in a regional product price. A buyer's commercial result also depends on purchase terms, carrying costs, and the timing and price of customer sales.
If a retailer bought fill against an already priced customer sale, the later $45/st market increase does not automatically become additional margin. The purchase may have served its purpose by covering the sale and securing delivery.
Unsold inventory carries a different exposure. It can benefit from higher prices, but it can also lose value. The $95/st decline in 2022 shows the size of that risk in this history.
Financing and storage costs reduce the benefit of holding inventory. Rebates and throughput credits can improve the economics. The time between purchase and sale matters, too.
For retailers and wholesalers, the practical starting point is how much product is needed for customer commitments, how much additional demand is reasonably expected, and how reliably the remaining tons can be delivered later.
This year, buying fill provided a clear price advantage. The ten-year record shows why the volume decision also needs to reflect the business's sales position, storage capacity, and working capital.
Research notes
Method and Scope
The comparison covers 2017–2026 and uses U.S. Corn Belt inland warehouse potash prices in U.S. dollars per short ton. Q4 means the October 1 price.
Annual price changes are rounded to the nearest $5. The average and median are calculated from those reported changes, with equal weight given to each year. Fill dates vary, so the comparison periods are not identical.
Excludes financing, storage costs, rebates, and throughput credits.
Price history and 2026 market commentary: FertiTrend.
References
- Mosaic, June 4, 2021. Early closure of Esterhazy K1 and K2 shafts following accelerated brine inflows.
- Council of the European Union, June 24, 2021. EU imposes sanctions on Belarusian economy.
- U.S. Treasury, August 9, 2021. Treasury Holds the Belarusian Regime to Account on Anniversary of Fraudulent Election.
- Office of Foreign Assets Control, FAQ 918. Belaruskali wind-down authorization through December 8, 2021.